

Event planning has changed a lot. Not just because of technology, but also because people expect more from events. Whether it is a small corporate meeting or a large trade show, organizers are trying to make every moment count. That is why looking at event Industry statistics is important. These numbers help planners understand what is working, what is not, and where things are heading.
This blog will go through the latest corporate event statistics, event planner statistics, and trends in In-Person event statistics, hybrid event statistics, and virtual event statistics. It will also touch on event technology statistics and other useful insights that help professionals make better decisions.
Major Event Industry Statistics & Trends
If you are an event organizer and want to improve your future event, you can consider these major event industry statistics.
1. In-Person Event Statistics
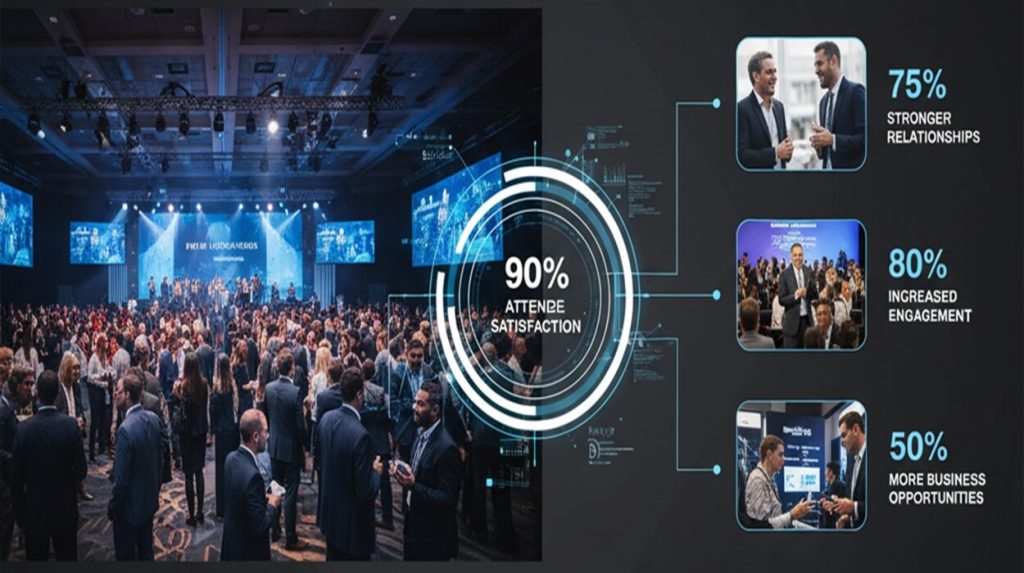
In-person events are still the most preferred format. Around 80% of attendees report enjoying in-person events. That is not surprising. People want to meet others face-to-face. They want to see products, ask questions, and feel part of something.
According to the report, 57% of attendees are enticed by the possibility of winning a reward or unique products, and almost 60% of attendees say they are more inclined to interact with a company at an event if they receive a freebie. The chance to get a giveaway also attracts 46% of respondents.
Planners are also leaning toward in-person formats. Nearly 9 out of 10 planners expect more onsite and offsite meetings in the coming year. But they are also facing cost issues. Food and beverage costs are higher than expected for 65% of planners. Accommodation rates are also a problem for 61 percent.
Venue selection is another challenge. While 94% of event planners are willing to pay more for a preferred venue, 97% say they would switch to a second choice if it saves them 20% or more of the cost. That shows how tight budgets are.
The biggest expenses for in-person events include:
- Food and beverage (73%)
- Audiovisual needs (66%)
- Venue (29%)
Planners are also sourcing special event venues more often.
There has been a 32% increase in sourcing unique venues compared to last year. This is partly to improve attendee experience and partly to save money.
Staffing issues at venues are also causing delays. About 39 percent of planners say hotels are slow to respond to RFPs. And 32% believe staffing shortages are the reason.
These In-Person event statistics show that while people still love attending events physically, planners are working hard to balance quality with cost.
2. Hybrid Event Statistics

Hybrid events are becoming more common.
They mix in-person and virtual elements, giving people more options. Around 15% of events in North America are expected to be hybrid this year. According to the study, 20% of meeting professionals say they prefer hybrid formats.
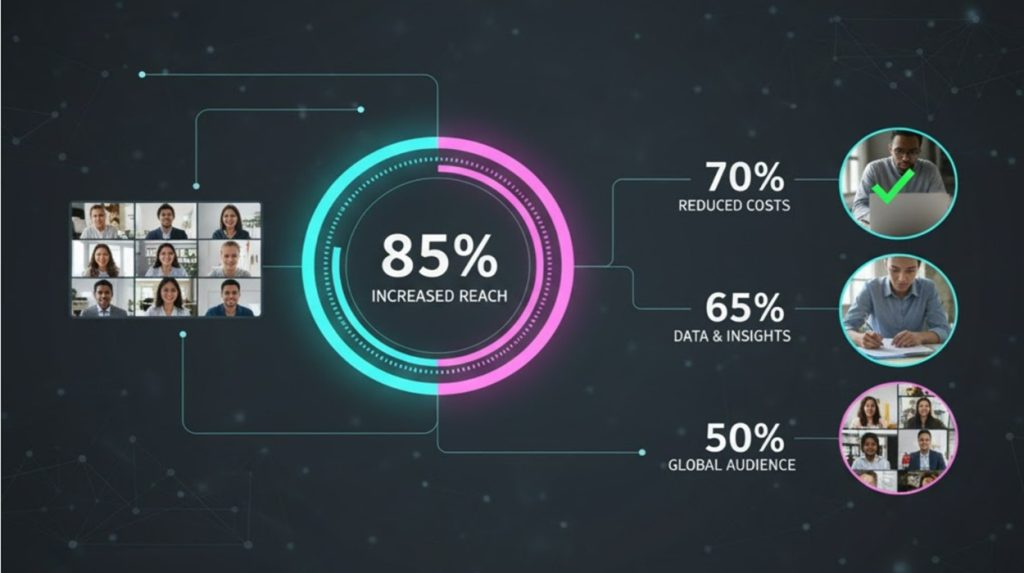
One reason is flexibility. About 52 percent of organizers say hybrid events help reduce travel. That is useful for companies trying to cut costs or reach people in different locations.
Associations are also seeing the value. Six out of ten say hybrid and virtual formats will remain a big part of their strategy. That means hybrid events are not just a trend. They are becoming a regular part of planning.
- Hybrid events are expected to grow by 18% globally in 2025, driven by demand for flexible participation options and cost-effective formats.
- According to the research, 41% of planners say hybrid formats increase attendance, especially among remote and international audiences.
- 35% of professionals report higher ROI from hybrid events compared to virtual-only formats, due to broader reach and better engagement.
- 48% of organizers use hybrid formats to offer on-demand content, helping extend the event’s value beyond its live schedule.
- 29% of companies say hybrid events improve sponsor visibility, combining physical branding with digital impressions.
- 54% of planners say hybrid formats allow better data collection, enabling them to track engagement across both in-person and virtual channels.
Hybrid event statistics show that this format is helping planners reach more people while keeping the in-person feel. It is not perfect, but it is working for many.
3. Virtual Event Statistics
Virtual events are growing fast.
According to the study, 21% of events worldwide are planned as virtual-only. And 63% of organizers say they will invest more in virtual formats this year.
A study shows that the global market for virtual events is expected to reach $537.18 billion by 2029. That is a big jump from $236.69 billion in 2025. The growth rate is around 22.7%.
Different types of virtual events are also growing:
- Virtual trade shows (Expected to reach $171.6 billion by 2032)
- Virtual product launches ($52.2 billion by 2032)
- Online training events ($26.6 billion by 2032)
People like watching videos to learn.
83% people prefer informational or instructional content in video format. And 66 percent say they watch at least one informational video every week.
But video length matters. While 24% prefer videos between 10 to 19 minutes, 58 percent want videos under 10 minutes. That means planners need to keep content short or break it into parts.
Longer videos still have value. Around 67% of people say they would watch a video over 60 minutes to learn a new skill. So, it depends on the goal.
To keep people engaged, planners should focus on:
- Easy-to-follow content (57% say this is important)
- Relatable topics
- Good speakers
- Use of an interactive tool
- Gamification
Professional graphics also help.
42% of people say visuals like infographics and overlays improve the experience. These virtual event statistics show that people want useful content, and they want it delivered in a way that is easy to understand.
Other Key Insights
Here are the other key insights that reveal emerging trends, growth patterns, and shifting priorities shaping the global event industry today.
Corporate Event Statistics
Corporate events are growing. According to the study, the global market was valued at $325 billion in 2023 and is expected to reach nearly $600 billion by 2029. That is a growth rate of 10.6%.
Almost 70 % of corporate events in North America are expected to be in-person. Incentive and special events are seeing the highest cost increases, followed by product launches and leadership meetings.
These corporate event statistics indicate that businesses still see value in face-to-face meetings, even with rising costs.
Event Planner Statistics
Event planners are optimistic. Around 74% of people feel positive about the state of events this year. And 52% people expect to organize more meetings compared to last year.
Still, they are dealing with challenges. Risk and compliance are very important for 75% of event planners. And 23 percent say understanding how a venue meets their needs is the biggest sourcing issue.
- Data-Driven Decisions: 81% of event planners now rely on real-time dashboards and robust analytics to measure and optimize event performance.
- Personalized Experiences: 64% of attendees prefer personalized recommendations, pushing planners to adopt AI matchmaking and tailored notifications.
- Tech at the Core: 60% of planners identify event apps as their most vital tool for managing operations, networking, and engagement tracking.
- Sustainability Matters: 72% of planners are implementing eco-friendly practices like digital badges and paperless workflows.
- ROI Challenges Persist: Only 23% of planners can measure ROI precisely, often depending on attendee satisfaction and lead volume as indicators.
- Hybrid Event Mastery: 87% of planners prioritize hybrid-ready platforms that integrate seamlessly with in-person, virtual, and hybrid formats.
- Networking Focus: 64% emphasize peer-to-peer networking tools such as AI matchmaking to enhance attendee satisfaction.
- Customization on Demand: No-code and white-label app solutions are increasingly favored for their flexibility and brand adaptability.
- Support and Training Essentials: Continuous support and guided onboarding are crucial for ensuring flawless execution at high-stakes events.
- Regional Priorities Differ: North America focuses on ROI, Europe leads in sustainability, and Asia-Pacific emphasizes engagement and diversity.
Event planner statistics also indicate that 79% of planners believe events are more valuable than other business activities like sales or marketing.
Event Technology Statistics
Yes, it is true that technology is changing how events are planned.
According to study, the global event management software market is expected to reach $107.28 billion by 2037. That is up from $14.37 billion in 2025.
About 89 percent of businesses say event tech saves them around 200 hours per year. And 91% of professionals say knowing how to use tech tools is a critical skill.
AI is leading the way. Around 50% of planners utilize AI to help with planning. Some use it for attendee matchmaking, others for content creation or tracking engagement.
Mobile apps and analytics tools are also popular. Planners utilize tech to improve attendee experience, review space diagrams and negotiate with venues.
- The global event management solution market is projected to reach $14.7 billion by 2029, growing at a compound annual rate of 11.6% from 2023, according to Statista.
- Over 89% of event professionals say technology saves them time, with many reporting over 200 hours saved annually through automation and digital tools.
- AI adoption in event planning has doubled since 2023, with planners using it for content generation, attendee matchmaking, and engagement tracking.
- Mobile event apps are used in 78% of large-scale events, helping attendees navigate schedules, connect with others, and receive real-time updates.
- More than 60% of planners use analytics tools to measure event success, focusing on metrics like session attendance, engagement rates, and ROI.
- Virtual and hybrid event platforms with integrated tech features have seen a 35% increase in demand, as planners seek seamless experiences across formats.
Read more about Essential 35 Event Registration Statistics You Must Know
Event technology statistics show that event tech solutions such as Dreamcast is not just a nice-to-have. It is becoming a must-have.
Final Words
Event industry statistics give planners a clear view of what is happening. In-person events are still strong, but hybrid and virtual formats are growing. Costs are rising, but so is the value of events. Corporate event statistics show that businesses are investing more. Event planner statistics reveal optimism and a focus on quality. Event technology statistics highlight how tools are helping planners save time and improve results.
Whether you are planning a small meeting or a large conference, these numbers can help you make better choices. They show what people want, what works best, and where the industry is heading.