

Harnessing the power of event registration analytics can significantly transform your ability to create successful events. It’s essential to identify the strengths of an event and the areas that need improvement. By doing so, event organizers can easily refine their offerings and develop a strategy to consistently achieve their goals.
The world of events is vast and diverse, offering numerous options for collecting data and measuring success. In this article, we will explore the key types of event data insights that can be utilized to enhance your events and share the most effective methods for evaluating your success.
What is Event Registration Analytics?
Event registration analytics is the process of collecting and analyzing data from the event registration process to gain insights that optimize the event registration experience. Also, it drives more attendee sign-ups and informs the overall event strategy.
Types of Event Registration Metrics

Let’s explore the crucial event registration analytics that provides insights into your event’s registration process. This event data analytics helps in understanding user behaviour, optimizing registration workflows, and improving overall event performance.
Event Metric #1: Event Registration Funnel Analysis
Drop-Off Rates
You must have heard about drop-off rates. These rates measure the percentage of users who abandon the registration process before completion. By analyzing where users exit the funnel, organizers can pinpoint problematic stages. For instance, high drop-off rates might indicate issues such as confusing forms or technical glitches, which need addressing to enhance the overall completion rates.
Event Registration Form Completion Rates
Form completion rates track the percentage of users who start and complete the registration form. This metric helps assess how user-friendly and efficient the event registration form template/design is. Consequently, a high completion rate suggests that the form is well-structured, while a low rate may signal a need for simplification or better instructions.
Time to Register
Time to register measures the average duration required for a user to complete the registration process from start to finish. Longer registration times can deter potential attendees. Therefore, understanding and optimizing this metric is crucial for creating a smoother, faster registration experience, which can lead to higher conversion rates.
Number of Steps in the Registration Process
Moreover, analyzing each step in the event registration process provides insights into where users might encounter difficulties or delays. Therefore, by evaluating the effectiveness of each step, organizers can streamline the process and reduce unnecessary steps.
User Experience Feedback
Collecting feedback from users about their registration experience offers qualitative event data insights into potential issues or areas for improvement. However, feedback can be gathered through surveys, interviews, or feedback forms, helping identify user pain points and opportunities for making the registration process user-friendly.
Mobile vs. Desktop Registration
This event data metric compares registration performance across different devices, such as mobile phones and desktops. Organizers need to understand device-specific behaviors, so that event registration can be optimized for different platforms. Considering the growing use of mobile devices, ensuring a smooth registration process on mobile is more critical than ever.
Read More: Overcome 8 Common Challenges During Event Registration
Event Metric #2: Revenue Metrics for Paid Events
Revenue metrics for paid events provide key insights into the financial performance and effectiveness of pricing strategies. The following table outlines essential metrics and their implications for evaluating event revenue.
| Revenue Metric | Description |
| Revenue Per Registration | Average amount earned per registrant. For instance, if $10,000 is earned from 500 registrations, revenue per registration is $20. Helps assess pricing effectiveness. |
| Total Revenue | Total income from all registrations. For instance, 1,000 attendees at $50 each result in $50,000. Provides a snapshot of financial success. |
| Refund and Cancellation Rates | Percentage of attendee registrations refunded or cancelled. For instance, 10 cancellations out of 200 is a 5% rate. Indicates satisfaction or stability issues. |
| Average Order Value | The average amount spent per transaction, including add-ons. For instance, if attendees spend $70 on average, including a $50 fee and $20 in extras, it shows up selling success. |
| Revenue from Upsells or Add-Ons | Income from additional purchases beyond the base registration fee. For instance, $5,000 from merchandise or premium access indicates upselling effectiveness. |
| Sponsorship Revenue | Income from sponsors. For instance, $15,000 from sponsors helps gauge their impact on total revenue and the value of sponsorships. |
Event Metric #3: Technical Performance Event Data Metrics
Website Load Times
Website load times are a key component of event registration analytics, showing how quickly a webpage appears for users. Slow loading can frustrate people and lead them to abandon the site. For example, if the event registration landing page takes too long to load, users might leave before signing up. Therefore, ensuring fast page load times is crucial for keeping users engaged and minimizing bounce rates, a vital aspect of event data insights.
Error Rate
Error rates measure how often users encounter problems such as broken links or malfunctioning features. High error rates can frustrate users and impede the registration process. Consequently, frequent errors on the site should be addressed promptly to ensure a smooth event registration process and enhance user satisfaction. Managing these error rates is an important aspect of analyzing event registration metrics.
Mobile Optimization
Mobile optimization is an essential part of event registration analytics, evaluating how well the event website and registration forms perform on smartphones and tablets. As mobile device usage grows, the site must look and function effectively on these platforms. Developing a mobile event app ensures a seamless registration process, enhances accessibility for attendees and prevents issues that could prevent users from completing their registration, thus providing valuable event data insights.
Server Downtime
Server downtime is a significant element of event registration metrics, tracking how often the website or registration system is unavailable due to issues like hardware failures or network interruptions. For instance, downtime during peak registration periods can lead to lost opportunities and frustrated users. Therefore, implementing strategies such as load balancing and server redundancy is critical for maintaining site availability and reliability.
Form Submission Errors
Form submission errors occur when users have trouble sending in their registration forms, often due to missing information or validation problems. These issues can prevent users from completing their registration. Addressing and fixing these errors is crucial for a smooth registration process and for improving the user experience, a key focus in event registration analytics.
Security Issues
Security issues involve potential risks that could compromise user data or the site’s integrity. If the site lacks robust security measures, it might be vulnerable to data breaches or cyberattacks. Consequently, implementing strong security protocols like SSL/TLS encryption and multi-factor authentication is vital.
Read More: Technical Problems During Events
Event Metric #4: Event Registration Sources
Referral Sources
Understanding where your event registrants are coming from is critical. Referral sources help you identify which external sites or specific referral links are driving traffic to your registration page. Analyzing these sources is crucial for event registration analytics as it reveals which platforms are most effective. For instance, if a significant number of sign-ups originate from industry-specific blogs or partner websites, this indicates successful referral strategies. Therefore, leveraging high-performing referral sources can enhance overall registration numbers and provide valuable event data insights.
Marketing Channel Effectiveness
Another key aspect to consider is how different marketing channels perform in driving event registrations. Evaluating marketing channel effectiveness involves looking at metrics like click-through rates and conversion rates to determine which channels offer the best return on investment (ROI). For example, if social media campaigns demonstrate a higher conversion rate compared to email marketing, reallocating resources to these more effective channels can optimize registration outcomes. This analysis is essential for tracking event registration metrics and gaining insights into attendee behaviour analysis.
Paid vs. Organic Registrations
Comparing paid versus organic registrations provides insight into the effectiveness of different promotional strategies. This metric helps assess how many attendees come from paid advertising versus those who discover the event through organic means such as search engines or social media. Notably, if paid registrations significantly outnumber organic ones, it may indicate successful ad spending. Conversely, a strong organic presence suggests effective natural reach. Analyzing this balance offers critical event data insights and highlights trends in registration strategies.
Partner and Affiliate Contributions
Examining partner and affiliate contributions sheds light on the impact of collaborations on event registrations. Contributions might come from affiliate links or co-branded promotions. If a major industry partner drives a substantial number of registrations through their network, it highlights the effectiveness of these partnerships. Evaluating these contributions helps inform decisions on future collaborations and affiliate strategies, offering insights into event registration metrics and how various partners affect attendee engagement tracking.
Influencer Impact
Finally, assessing influencer impact involves understanding how influencers contribute to driving event registrations. This includes evaluating metrics such as referral traffic and registration numbers resulting from influencer campaigns. When a well-known influencer significantly boosts registrations, it demonstrates the effectiveness of influencer marketing. Understanding this impact helps optimize future collaborations and aligns them with event registration trends.
Read More: 8 Best Practices for Seamless Event Registrations
Event Metric #5: Attendee Engagement Analytics/Metrics
Pre-Event Engagement
Over 82% of B2B marketers consider attendee engagement an important key performance indicator (KPI) for determining an event’s impact. Racking pre-event engagement involves monitoring interactions such as email open rates, RSVP responses, and engagement with pre-event content. This aspect of attendee behaviour analysis helps you gauge early interest and involvement. High pre-event engagement typically indicates strong anticipation and preparation among attendees
On-Site Check-In Rates
Event on-site check-in rates measure the percentage of registered attendees who check in at the event. This metric is vital for attendee engagement tracking as it reflects the efficiency of check-in processes and how well attendees follow through with their registration. High check-in rates usually indicate effective event operations. Improving registration and event check-in procedures can help increase these rates.
Session Attendance
Session attendance tracks how many participants attend specific sessions or activities within the event. This metric provides insights into popular content areas and helps with attendee behavior analysis by showing which sessions attract the most interest. Adjusting session scheduling and content based on attendance data can optimize future events and better align with attendee preferences.
Social Media Mentions
According to a survey by Social Media Examiner 2023, events promoted through social media see a 20% higher registration rate compared to those that are not. Social media mentions measure how often your event is discussed across platforms such as Twitter, Facebook, and LinkedIn. This metric is useful for understanding the event’s online visibility and overall attendee engagement. Increased mentions generally reflect higher levels of participant interaction and interest.
Interactive Features Usage
Tracking interactive features usage involves monitoring how attendees engage with tools like live polls, Q&A sessions, or virtual networking spaces. This aspect of attendee engagement tracking helps assess the level of interaction with event-specific components designed to enhance the experience. High usage indicates that attendees are actively participating and valuing these features. Promoting and improving these tools can increase their usage and impact.
Learn More: Best Event Registration Tools and Features
Event Metric #6: Post-Event Data Analysis
To gauge the true success and impact of your event, it’s essential to analyze data collected after the event concludes. This analysis provides valuable insights into attendee satisfaction, engagement, and overall effectiveness. Here’s a table showcasing post-event data insights:
| Metric | Description |
| Survey Responses | Measures the number and quality of responses collected from post-event surveys. Provides direct insights into attendee satisfaction and areas for improvement. |
| Net Promoter Score (NPS) | Assesses attendee loyalty by asking how likely they are to recommend the event to others. This score indicates overall satisfaction and potential for future event promotion. |
| Retention and Repeat Attendance | Tracks the percentage of attendees who return to future events. Indicates the effectiveness of event experiences in fostering long-term attendee loyalty. |
| Event ROI | Evaluates the return on investment by comparing the event’s total revenue to its total costs. Helps determine the financial success and profitability of the event. |
| Qualitative Feedback | Analyzes detailed comments and suggestions from attendees to gain deeper insights into their experiences. Provides context and specific suggestions for improvement. |
| Post-Event Engagement Rates | Measures ongoing interactions with event content after the event has concluded, such as social media activity or content views. Indicates continued interest and engagement. |
Event Metric #7: Event Conversion Rates
To measure the effectiveness of your promotional efforts, it’s crucial to analyze various event conversion rates. These metrics provide insights into how well different channels and content are performing in driving registrations.
Visitor-to-Registration Conversion Rate
Measures the percentage of website visitors who complete the registration process. A higher rate indicates an effective registration funnel and compelling website content.
Email Campaign Conversion Rates
Tracks the percentage of email recipients who register for the event. High rates show that email content and calls-to-action are effective in driving registrations.
Social Media Conversion Rates
Find out how well social media promotions convert into event registrations. This metric reflects the effectiveness of social media strategies and engagement.
Event Landing Page Conversion Rates
Evaluates the percentage of visitors to a landing page who complete registration. High rates suggest the landing page is effective in converting visitors through strong design and messaging.
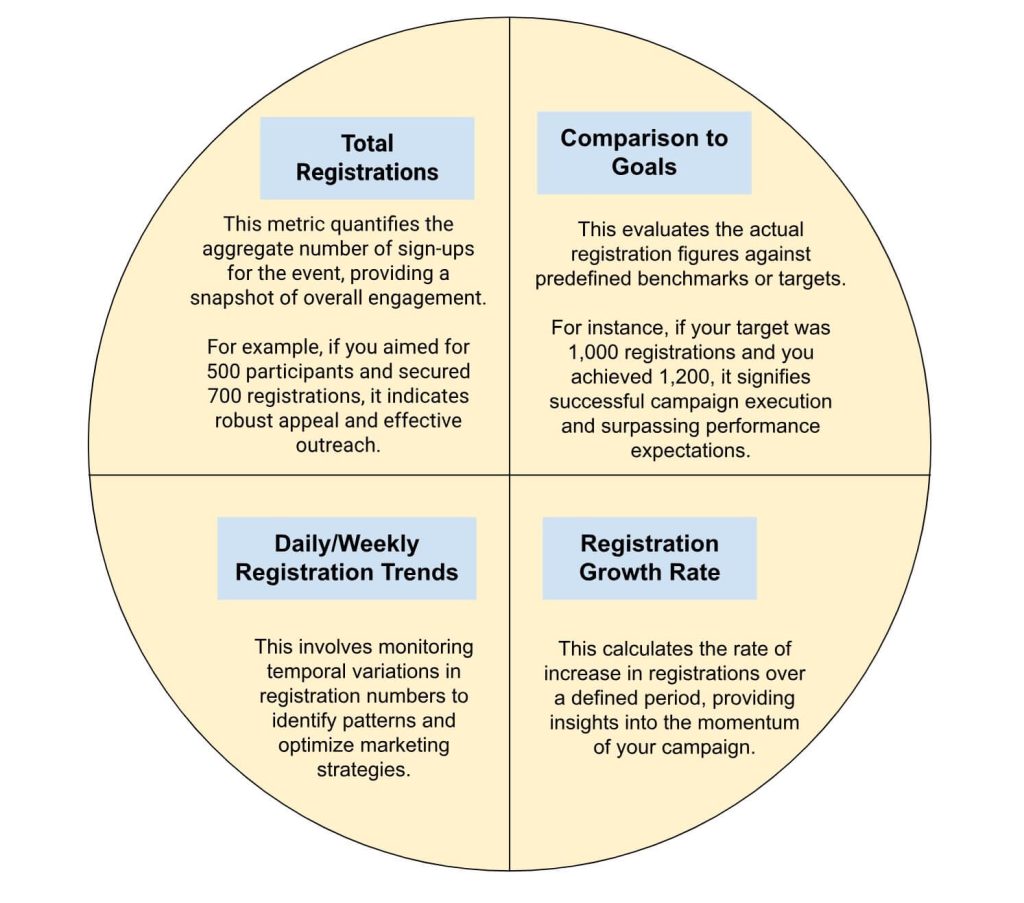
Event Metric #8: Event Registration Numbers
To gauge the event registration analytics and effectiveness of your promotional strategies, it’s essential to analyze various event conversion rates. These metrics offer insights into the efficacy of different channels and content in driving registrations.
Event Registration Data Metrics
Event Metric #9: Event Insights and Actionable Recommendations
To maximize the impact of your event, it’s crucial to not only collect event data but also to interpret it effectively and apply actionable recommendations. Here’s how to leverage event data insights for future success:
Data Interpretation
Data interpretation involves analyzing event metrics to extract meaningful insights. For example, if your data shows a high drop-off rate during registration, it suggests potential issues with the registration process. By understanding these insights, you can make informed decisions to address problems and enhance overall performance.
Benchmarking
Benchmarking compares your event’s performance metrics against industry standards or past events. For example, if industry standards suggest a 5% conversion rate from email campaigns and your event achieves 7%, this indicates strong performance. Benchmarking helps set realistic goals and identify areas for improvement.
Future Strategy Adjustments
Future strategy adjustments involve modifying your approach based on insights gained from current event data. If post-event feedback highlights a need for more interactive sessions, incorporating more of these into future events can enhance attendee satisfaction and engagement.
Conclusion
Harnessing event registration analytics allows for precise adjustments and improvements. By leveraging detailed metrics, you can enhance processes, optimize user experiences, and ensure greater success for future events.
At Dreamcast, we offer a comprehensive suite of event registration and ticketing solutions designed to keep pace with the latest event registration trends. Our platform provides robust event registration analytics and detailed metrics, enabling you to streamline the registration process and enhance event success. By partnering with us, you ensure a seamless experience for both organizers and attendees, while staying ahead of industry trends to drive better results and deeper engagement.
FAQs
How Is Data Analytics Used In Event Planning?
Data analytics helps event planners understand attendee behavior, personalize marketing, optimize logistics, lead nurturing, and measure event success. This leads to better decision-making and improved event experiences.
How Does Google Analytics Track Events?
Google Analytics tracks events by recording specific user interactions like clicks and form submissions. Events are categorized into automatically collected, enhanced measurement, recommended, and custom events, providing detailed reports on user behavior.
What Is The Best Platform For Event Registration?
Top event registration platforms include Dreamcast, Wild Apricot, etc. Each offers unique features, so choose based on ease of use, customization, integration capabilities, and cost.
What are the KPI for event ROI?
These are the key performance indicators for gauging event ROI: total revenue, total costs, net profit, revenue per attendee, cost per attendee, sponsorship revenue, upsell and add-on revenue, attendee acquisition cost, conversion rate, and customer lifetime value (CLV).